Click the graph to see the data source.
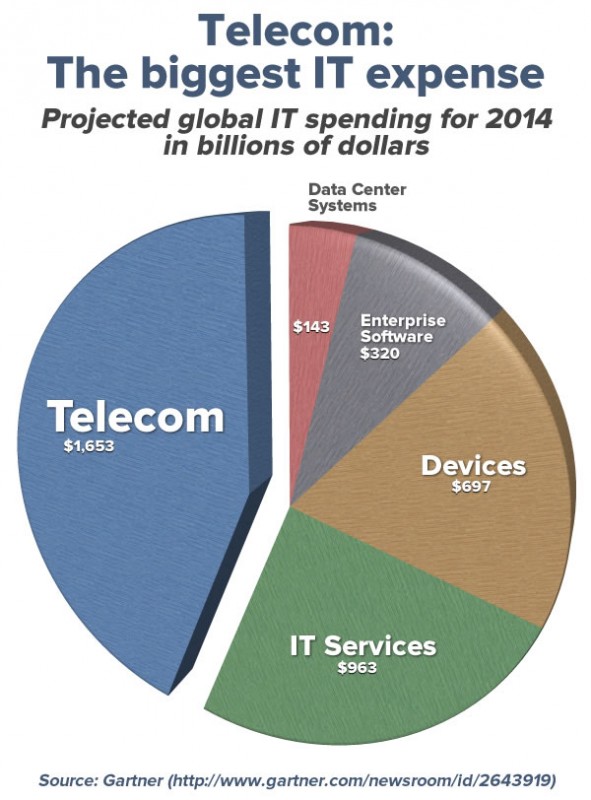
Back in January, Gartner announced that after a flat 2013, they projected that worldwide IT spending would grow in 2014 to reach $3.8 trillion in 2014. They even published a table breaking down this projected spending into categories: data center systems, devices, enterprise software, IT services, and telecom. What they didn’t do — and for some reason, analysts often skip this part — is turn those non-intuitive rows and columns numbers into a more intuitive visual representation. We did, and the result is the chart above.
The chart makes very clear what we’ve been saying all along: telecom is by and large the largest slice of the IT budget pie. At nearly 44%, telecom’s share of IT spending is:
- Nearly twice as large as the next category, IT services (26%),
- almost two and a half times the size of devices’ cut (18%), and
- over five times that of enterprise software (8%).

As the largest part of the IT budget, telecom also provides the most opportunities to find efficiencies and places to save money:
- Invoices from telecom carriers often have errors — and usually in their favor.
- Many businesses are wired for 20th-century telecom and “overtrunked” with too much voice line capacity, while today’s workers rely more on wireless phones, and internet-based communication like email and instant messaging. Many are spending money on contracts to maintain PBX facilities that are no longer needed or lie in disuse.
- Then there are the hundreds, if not thousands, of wireless plans in a business that are mismatched to their users’ actual voice, messaging, and data usage.

