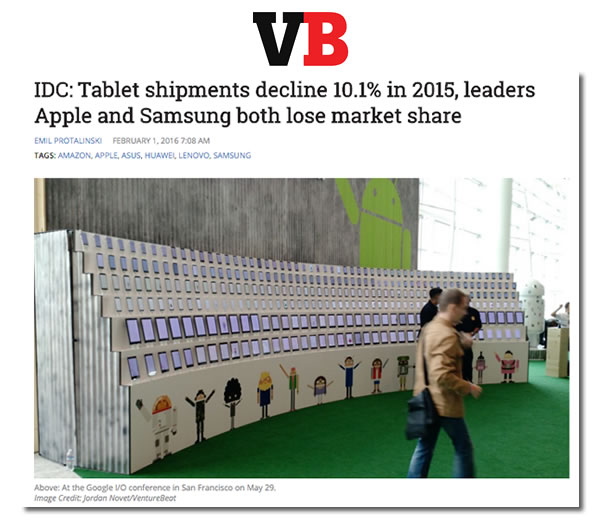
VentureBeat have posted their report on IDC’s quarterly tablet sales tracker, and like Business Insider before them, they were content to simply publish screen shots of IDC’s tables.
Here at Global Nerdy, we like to do a little more to help you better understand the numbers. So here are:
- Some nicely-formatted versions of IDC’s tables
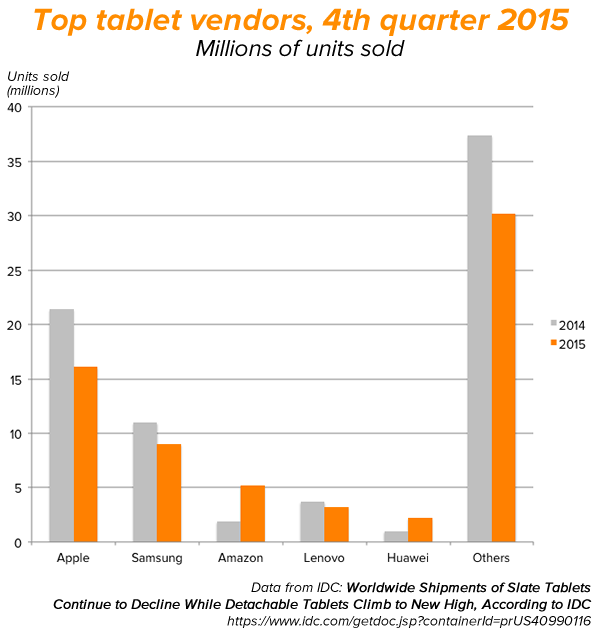
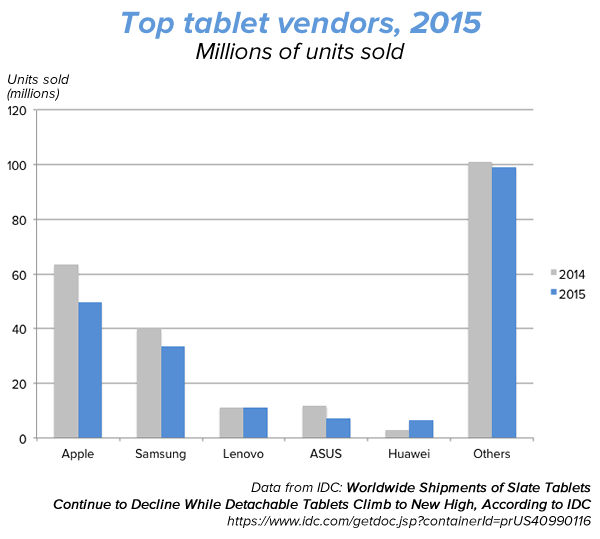
- The data from those tables turned into graphs
- A downloadable spreadsheet so that you can play with IDC’s numbers.
Enjoy!
Top Five Tablet Vendors, Shipments, Market Share, and Change, Fourth Quarter 2015
Shipments are in millions of units:
| 4Q14 Unit Shipments | 4Q14 Market Share | 4Q15 Unit Shipments | 4Q15 Market Share | Year-Over-Year Change | |
| Apple | 21.4 | 28.0% | 16.1 | 24.4% | -24.8% |
| Samsung | 11.0 | 14.4% | 9.0 | 13.7% | -18.1% |
| Amazon | 1.9 | 2.5% | 5.2 | 7.9% | 175.7% |
| Lenovo | 3.7 | 4.8% | 3.2 | 4.9% | -13.5% |
| Huawei | 1.0 | 1.3% | 2.2 | 3.3% | 124.6% |
| Others | 37.4 | 49.0% | 30.2 | 45.8% | -19.2% |
| Total | 76.4 | 100.0% | 65.9 | 100.0% | -13.7% |

Top Five Tablet Vendors, Shipments, Market Share, and Change, 2015
Shipments are in millions of units:
| 2014 Unit Shipments | 2014 Market Share | 2015 Unit Shipments | 2015 Market Share | Year-Over-Year Change | |
| Apple | 63.4 | 27.6% | 49.6 | 24.0% | -21.8% |
| Samsung | 39.8 | 17.3% | 33.4 | 16.1% | -16.1% |
| Lenovo | 11.2 | 4.9% | 11.2 | 5.4% | 0.4% |
| ASUS | 11.8 | 5.1% | 7.1 | 3.4% | -39.9% |
| Huawei | 3.0 | 1.3% | 6.5 | 3.1% | 116.6% |
| Others | 100.9 | 43.9% | 99.1 | 47.9% | -1.8% |
| Total | 230.1 | 100.0% | 206.9 | 100.0% | -10.1% |

