What Types of Apps are People Downloading?
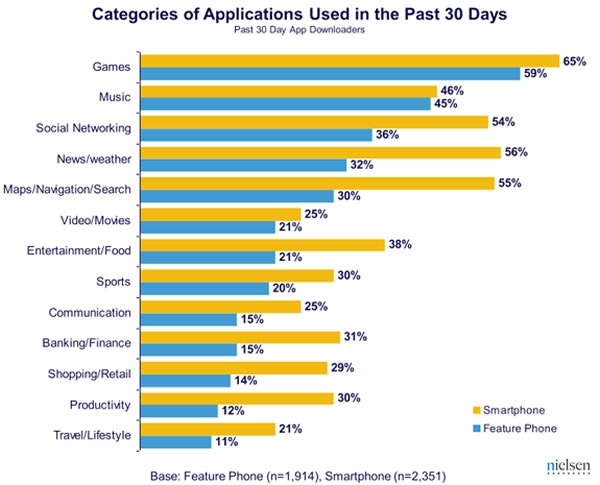
The surveying company Nielsen recently posted some mobile app figures from its report, the App Playbook, whose data is based on a survey of 4,200 people who downloaded a mobile phone application in the past 30 days. Here’s their chart showing the downloaded apps by category:

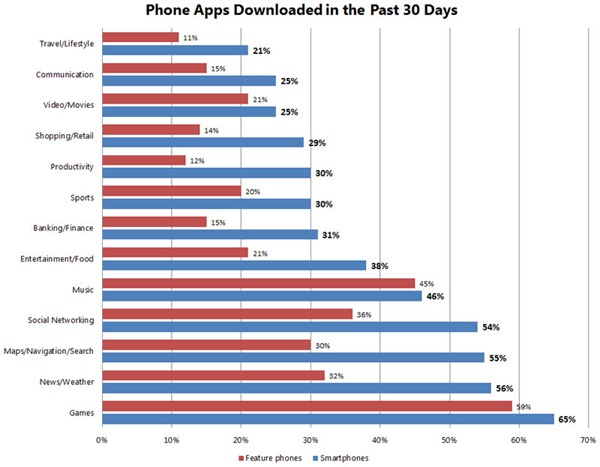
I reworked the chart to list the categories from least to most downloaded (I also gave it a more accurate title). You can click the revised chart below to see it at full size:

As you can see, the top 5 mobile app categories are (from most to least downloaded):
- Games
- News/Weather
- Maps/Navigation/Search
- Social Networking
- Music
These top categories, once boiled down to their essence, would seem to indicate that mobile app users want to:
- Be entertained
- Find out what’s happening
- Know where things are
Perhaps it’s time to come up with an app that combines all three of these. I’m leaving that as an exercise for the reader.
Smartphone Penetration

In the fourth quarter of 2009, 21% of American wireless subscribers – a sliver over 1 in 5 – had a smartphone. That means that there are still 4 our of 5 U.S. wireless subscribers who have yet to make a smartphone purchase.
This figure is up from 19% in the previous quarter and a significant jump up from 14% at the end of 2008. I don’t know whether the Canadian figures are similar; while we’re similar to the U.S. culturally, they get much better deals from their mobile companies, which may affect usage patterns.
Who’s Downloaded Apps, and How Many?

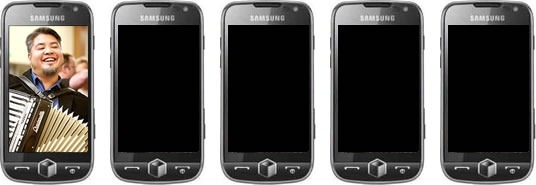
According to Nielsen’s survey, 14% of American wireless subscribers – a shade under 1 in 6 – downloaded a mobile app in the last 30 days.
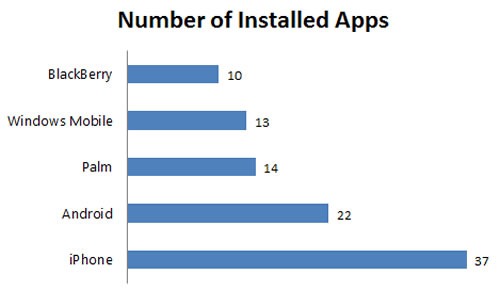
Smartphone users had an average of 22 installed apps, while feature phone users had 10. Here’s the count of installed apps for smartphones broken down by OS:

There are more figures in the NielsenWire article covering mobile app use – be sure to read it!
This article also appears in Canadian Developer Connection.


